COVID-19 Data Dashboard
Article | 08.19.2020By Kray Freestone, GIS Technician
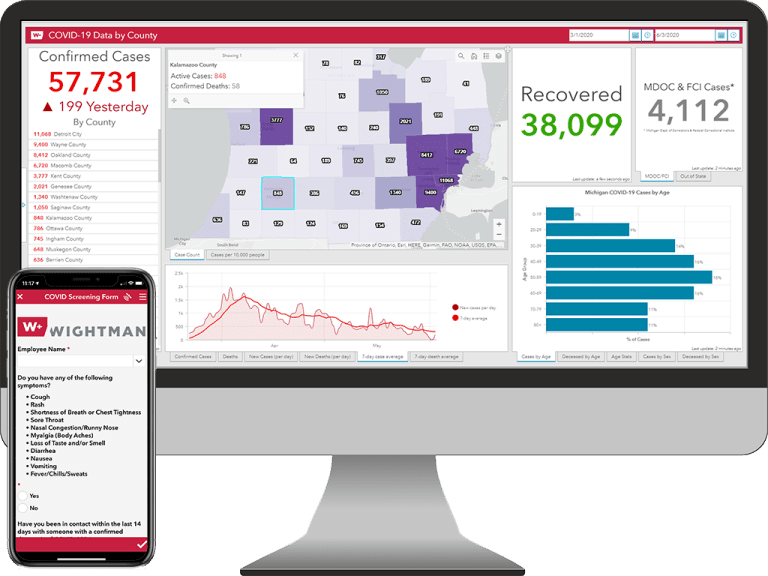
While COVID-19 has produced much uncertainty, it has also produced an explosion in data visualization. These visualizations help us understand the impact of COVID-19 and a global, national, and even local scale. The Berrien County Health Department has recently launched a COVID-19 dashboard to help track pandemic’s effect on the county.
Previously, the county was updating the dashboard manually via an Excel spreadsheet. With the help of Python automation, Wightman created a tool that allows Berrien County to quickly and accurately update the dashboard with the click of a button.
The tool reads through each worksheet of the Excel file, formats it, and then uploads it to ArcGIS Online through Esri’s ArcGIS Online Python API. What was once labor intensive is now scheduled to run on its own - no human interaction necessary. This helps the officials of Berrien County focus on what matters, helping the community.
To learn more about this unique tool, read these articles from Moody on the Market on how the Wightman GIS team has helped Berrien County Health Department.